Bill of Material a.k.a ‘BOM’ is a comprehensive list of raw materials, components, assemblies, sub-assemblies, parts, or anything which is required to manufacture the finished product.
In this Tech Tip, we will show you how to create BOM Table and Balloons in Creo Parametric Drawing. You will also know ‘Recursive’ type BOM Table.
You can go through following steps or view this Video directly to know about BOM Table and Balloons.
The User Case
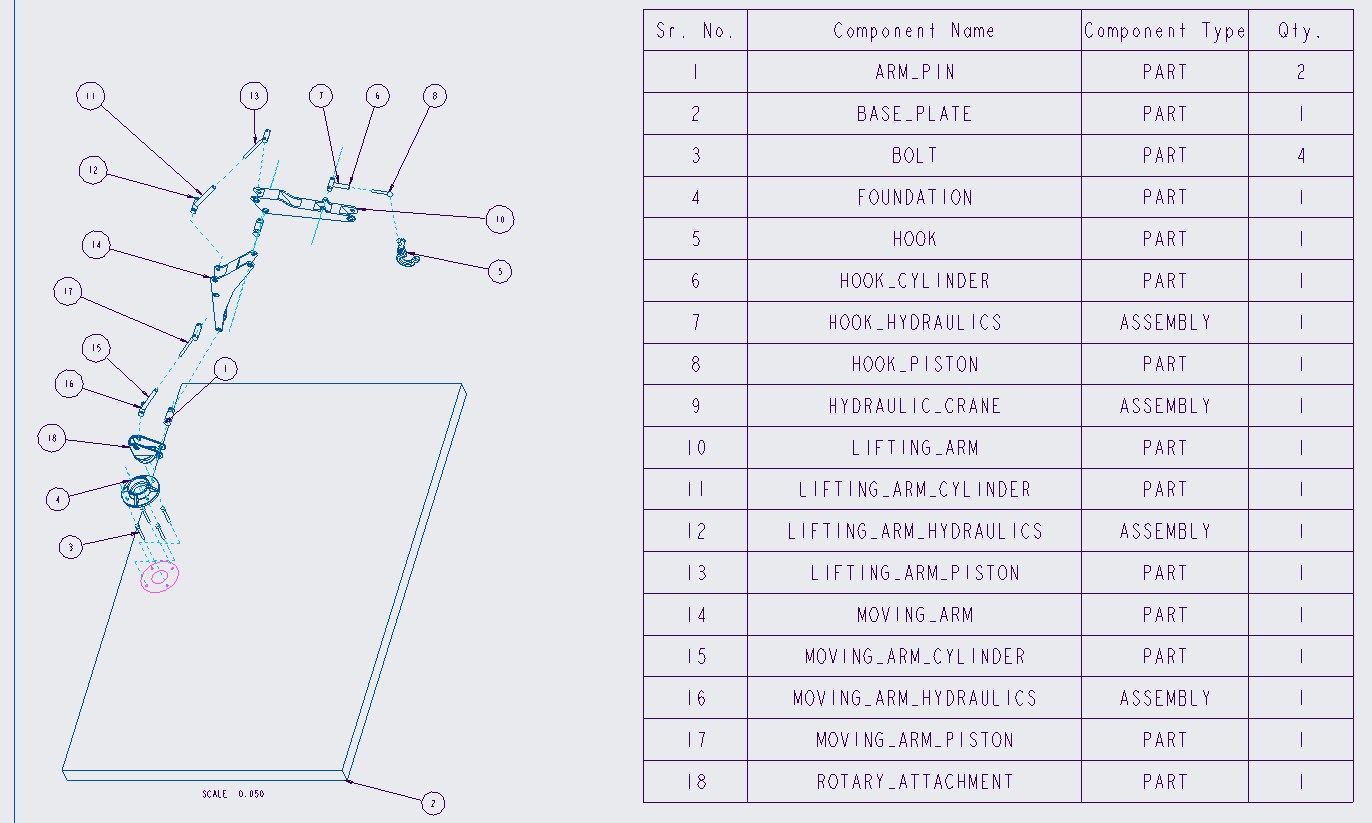
In the figure below, the Hydraulic Crane assembly is shown with two views – one main view and another exploded view. This assembly contains total 14 components and 3 subassemblies. We can show all this information in the Creo drawing with BOM Table and Balloons.
You can download part files to practice as well by subscribing to i GET IT with relevant role Engineering Job Roles – i GET IT,

Figure 1: Two views of Hydraulic Crane Assembly
Observe below steps to achieve the required result –
Step 1
Open the file hydraulic_crane.asm
Step 2

Create a new drawing with following specifications and name it to hydraulic_crane.drw
Step 3
Create a ‘General View’ with following specifications

Step 4

Create a 4×2 table as shown from the ‘Table’ tab.
Step 5
Select the ‘Properties’ menu for the table as shown

Step 6

Change the height of table rows to table rows to 1 as shown
Step 7
Select the ‘Height and Width’ menu for first table column as shown –

Step 8

Change the width of first table column to 2.5 as shown.
Step 9
Change the width of second, third and fourth table columns to 8, 4 and 2.5 respectively

Step 10

Right click on the left side upper table cell and select ‘Properties’.
Step 11
Type in the text

Step 12
Change the Text Style as shown

Step 13
Type in the following texts in the upper second, third and fourth table cells and change their text style as per the step 12

Step 14
Select ‘Repeat Region’ command from the Data Group of ‘Table’ tab

Step 15
Select ‘Add’ option from the Menu Manager

Step 16
Following message log will display

Step 17
Select the corners of the repeat region as shown

Step 18
Click ‘Done’ in the Menu Manager

Step 19
Observe that the repeat region highlights after clicking one of the repeat regions cells

Step 20
Select the First cell from the repeat region, right click and then select ‘Report Parameter’

Step 21
Select the report symbol ‘rpt’ followed by ‘index’

Step 22
For second cell of repeat region, enter following report parameters

Step 23
For third cell of repeat region, enter following report parameters

Step 24
For fourth cell of repeat region, enter following report parameters

Step 25
For all four cells of repeat region, change the text style as per step 12 and then the table should look as follows

Step 26
Select ‘Update Tables’ command from the ‘Data’ group of ‘Table’ tab

Step 27
The table will update as follows

Step 28
Select ‘Repeat Region’ command from the ‘Data’ group of ‘Table’ tab

Step 29
Select ‘Attributes’ option from the Menu Manager

Step 30
Then select the repeat region

Step 31
Select the ‘No Duplicates’ option from the Menu Manager and then Select ‘Done/Return’

The table updates as follows

Step 32
Repeat steps 28 to 30.
Step 33
Select ‘Recursive’ option from the Menu Manager and then select Done/Return ——–> Done From the Menu Manager

Step 34
The table updates as follows

Step 35
Select ‘Create Balloons – All’ option from the ‘Balloons’ group of Table tab

Step 36
Rearrange the created balloons and then the drawing will look as follows

About i GET IT
i GET IT is our Tata Technologies eLearning solution designed to teach engineers how to be better in using today’s leading MCAD (Mechanical Computer Aided Design) applications and design skills.
For more tech tips and in-depth eLearning for CATIA V5, including this and new courses on other design solutions, please visit https://www.myigetit.com. You can sign up and get FREE Subscription when joining through SkillAdvisor to get our informative Newsletter.
Start your upskilling journey!
If you should have any questions, please reach out to iproducts@tatatechnologies.com or igetitsocial@tatatechnologies.com for help.


Leave a Reply